22.3 Illustration of K-Means Clustering Using a Sample Dataset

To understand how the K-Means clustering algorithm works, let us consider a small customer dataset.
Each customer is represented using two attributes: Annual Income and Spending Score.
The objective of K-Means is to group similar customers into clusters such that customers within the same cluster are more similar to each other than to those in other clusters.
In this example, we apply K-Means with K = 2 and calculate the centroid and cluster assignments step by step using Euclidean distance.
Distance Measure Used
Most commonly used:
- Euclidean Distance
Why?
Simple
Works well for numerical data
step-by-step solution of the K-Means clustering algorithm (with K = 2) done on a small customer dataset.
It is K-Means Clustering applied to customer data:
Feature 1 (x) → Annual Income (₹L)
Feature 2 (y) → Spending Score
Each customer is a 2-D point (x, y).
The goal of K-Means:
Group similar customers into clusters based on distance.
Given Data (Customers as points)

Consider, there are two natural groups:
Low income – low spending
High income – high spending
So K = 2.
STEP 1: Choose Number of Clusters
K=2K = 2K=2
Because visually the data has two natural groups:
Low income – low spending
High income – high spending
STEP 2: Initialize Centroids
Two customers are randomly picked as initial centroids:
Centroid C1 = (2, 15) → from P1
Centroid C2 = (10, 80) → from P4
These are written and circled in the images.
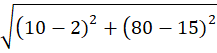
STEP 3: Distance Formula Used
For every point, distance to each centroid is calculated using Euclidean distance:
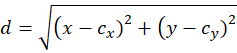
Where:
- x,y→ customer data
cx,cy→ centroid values
ITERATION 1
Compute distance of EACH point to BOTH centroids
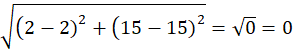
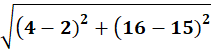
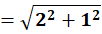
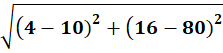
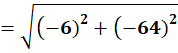
Point P1 = (2, 15)
Distance to C1 = (2,15)
Distance to C2 = (10,80)
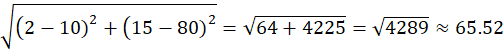
Assigned to Cluster C1
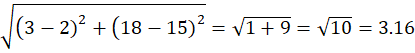
Point P2 = (3,18)
Distance to C1 = (2,15)
Distance to C2 = (10,80)
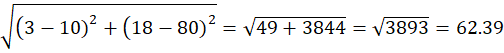
P2 → Cluster C1
P3 (4,12)
To C1:
To C2:
P3→ Cluster C1
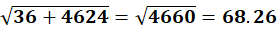
P4 = (10,80)
To C1 (2,15):


To C2 (10,80):

P4 → C2
P5 = (12,85)
To C1:


To C2:


P5 → C2
P6 = (11,78)
To C1:
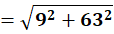
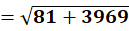


To C2:
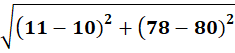
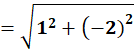


P6 → C2
P7 = (4,16)
To C1:


To C2:


P7 → C1
P8 = (3,14)
To C1:


To C2:


P8 → C1
Final clusters after Iteration 1
Cluster C1:
P1,P2,P3,P7,P8
Cluster C2:
P4,P5,P6
Final Centroids
C1:

C1 = (3.2,15)
C2:
C2 = (11,81)
FINAL RESULT
Cluster 1: P1,P2,P3,P7,P8
Cluster 2: P4,P5,P6
Centroids:
(3.2,15) and (11,81)
ITERATION 2 (Recheck)
Now compute again using:
After recalculating distances (shown previously):
P1,P2,P3,P7,P8 remain closer to C1
P4,P5,P6 remain closer to C2
No point changes cluster.
Algorithm Converges
Since assignments do not change, centroids remain same.
FINAL ANSWER
Cluster 1
P1, P2, P3, P7, P8
Centroid = (3.2 , 15)
Cluster 2
P4, P5, P6
Centroid = (11 , 81)


