22.2 How to Apply K-Means Clustering Algorithm

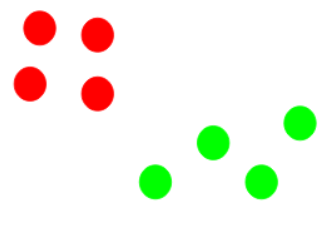
Suppose we have 8 data points on a graph.
Our goal is to group these points into clusters using the K-Means algorithm.

Step 1: Choose the Number of Clusters (K)
First, we decide how many clusters we want.
Let us choose K = 2, meaning:
- We want to divide the 8 points into 2 groups.
This value of K is chosen before running the algorithm.
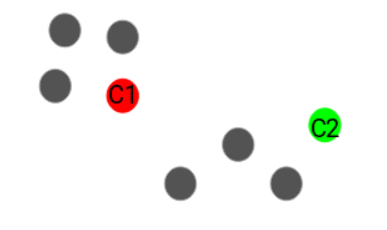
Step 2: Select K Random Points as Initial Centroids
Since K = 2, we randomly select 2 points from the dataset.
These points act as the initial centroids.
In the diagram:
One centroid is shown in red
The other centroid is shown in green
At this stage, centroids may not be in the correct position. They are only a starting guess.
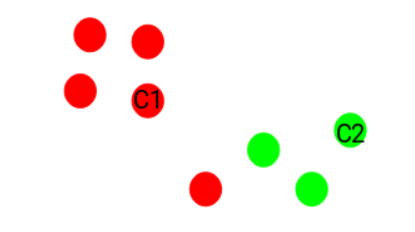
Step 3: Assign Each Point to the Nearest Centroid
For each of the 8 data points:
Calculate the distance from the red centroid
Calculate the distance from the green centroid
Assign the point to the cluster whose centroid is closest.
Result:
Points closer to the red centroid → Red cluster
Points closer to the green centroid → Green cluster
This forms the first set of clusters.
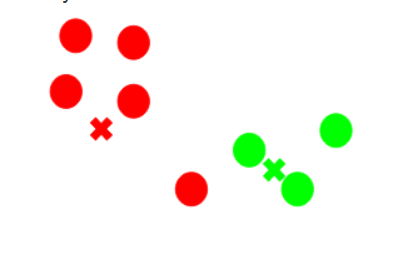
Step 4: Recompute the Centroids
Now, for each cluster:
Take all points belonging to that cluster
Calculate their mean (average position)
The mean position becomes the new centroid.
In the diagram:
- Red and green crosses represent the new centroids
Centroids move toward the center of their respective clusters.
Step 5: Repeat Steps 3 and 4 (Iterations)
Using the new centroids:
Again assign points to the nearest centroid
Again recompute the centroids
One complete cycle of:
Assigning points
Updating centroids
is called one iteration.
This process is repeated multiple times.
Applications of K-Means Clustering
1️⃣Customer Segmentation
Groups customers based on age, income, spending behavior, etc.
Helps businesses understand different customer types.
Used in marketing and sales.
2️⃣ Image Segmentation
Groups similar pixels in an image.
Used to separate objects from background.
Applied in computer vision and image processing.
3️⃣ Document and Text Clustering
Groups similar documents or articles together.
Used in search engines and news categorization.
Helps in organizing large text data.
4️⃣ Market Basket Analysis
Groups customers based on purchase patterns.
Helps retailers recommend products.
Used in e-commerce platforms.
5️⃣ Social Network Analysis
Identifies communities or groups with similar interests.
Used in friend suggestions and group recommendations.
6️⃣ Medical Data Analysis
Groups patients based on symptoms or medical records.
Helps in identifying disease patterns.
Used in healthcare research.
7️⃣ Anomaly Detection (Basic)
Helps identify unusual data points.
Used in fraud detection and network security.
8️⃣ Geographical Data Analysis
Groups locations based on distance and features.
Used in city planning, weather analysis, and location-based services.